
A retail loss prevention budget is built by calculating the retailer's shrink rate, assigning a spend ceiling relative to sales, and allocating it across people, technology, physical fixtures and process controls according to store-level risk. Spend should be justified by the shrink it prevents rather than set as a fixed overhead line.
An effective budget is risk-weighted, measurable and reviewed at least annually. The sections below cover the benchmark percentages, the cost categories, store allocation, the role of fixtures and displays, and the methods that demonstrate return on investment.
No universal percentage exists, but most retail chains set the loss prevention budget as a proportion of their shrink exposure rather than of total sales. A practical starting point is to spend a fraction of annual shrink losses, then adjust for category risk, store format and trading environment.
Shrink is typically measured as a percentage of sales, so the two figures are linked. A chain with a 1.5% shrink rate on £100 million of sales is losing £1.5 million each year. Budgeting against that figure gives finance teams a defensible logic: spend should be proportionate to recoverable loss.
Several factors move the ratio up or down:
Benchmark the figure against internal historical data first. External industry averages vary widely by sector, so they should inform the discussion rather than dictate the number.
A retail loss prevention budget should cover every cost incurred to deter, detect and respond to shrink, including labour, technology, physical security fixtures, training, auditing and ongoing maintenance. Omitting any category produces an incomplete return on investment calculation and hides the true cost of protection.
The principal cost categories are:
Maintenance is the most frequently underbudgeted line. A damaged lock, a loose fixture or a faulty alarm tag undermines the entire investment. Allocating a recurring maintenance provision protects the capital already spent.
Allocate loss prevention spend by ranking stores according to measured shrink risk, then directing proportionally more investment to high-loss locations. A tiered model, with a baseline package for every store and enhanced packages for high-risk sites, delivers better results than spreading the budget evenly.
A workable approach follows three steps:
Revisit the tiers quarterly. Shrink patterns shift as organised retail crime moves between regions and as stores change format. A static allocation becomes inaccurate within months, whereas a data-led model keeps spend aligned with actual exposure.
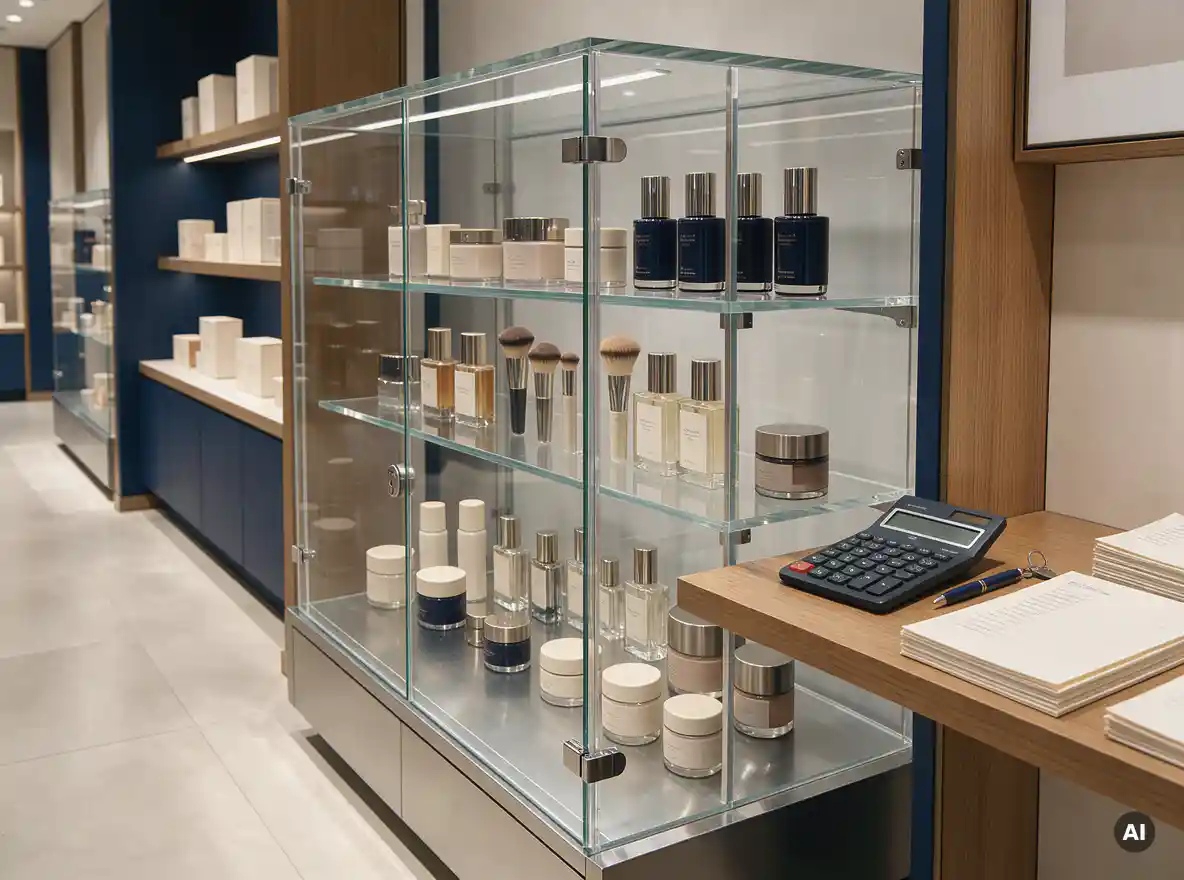
Yes. Well-designed fixtures and displays reduce shrink by limiting concealment opportunities, improving sightlines, securing high-risk products and slowing opportunistic theft without obstructing the shopper journey. Fixture design is a preventive control that operates continuously, without the ongoing labour cost of guarding.
Effective design principles include:
The challenge for brands and retailers is balancing protection with conversion. Over-secured products reduce engagement and sales, which erodes the margin the budget is meant to protect. Bespoke point of sale and display design resolves this tension by embedding security features into a fixture that still presents the product attractively. Retailers should also account for upkeep: a retail maintenance programme keeps locks, fixtures and displays functioning as specified, preserving the protective value of the original investment.
Prove loss prevention spending is worthwhile by comparing shrink before and after each intervention, calculating the net return against the cost of the control, and tracking the result against control stores that received no change. Consistent measurement turns a cost centre into a documented profit protection function.
Use these methods to build a credible case:
Be transparent about attribution. Where a result cannot be separated from other influences, state that clearly. Credible reporting strengthens the case for continued investment and supports faster approval of future budget requests.
Pivotal is a full-service retail design company that creates, makes, installs and maintains in-store solutions through a single turn-key process. For brands and retailers building a loss prevention budget, this means protective fixtures and displays are designed, manufactured and fitted by one accountable partner, using its own employed fitters.
To discuss protective, brand-led fixtures for your retail estate, contact Pivotal today and start planning your next in-store programme.