
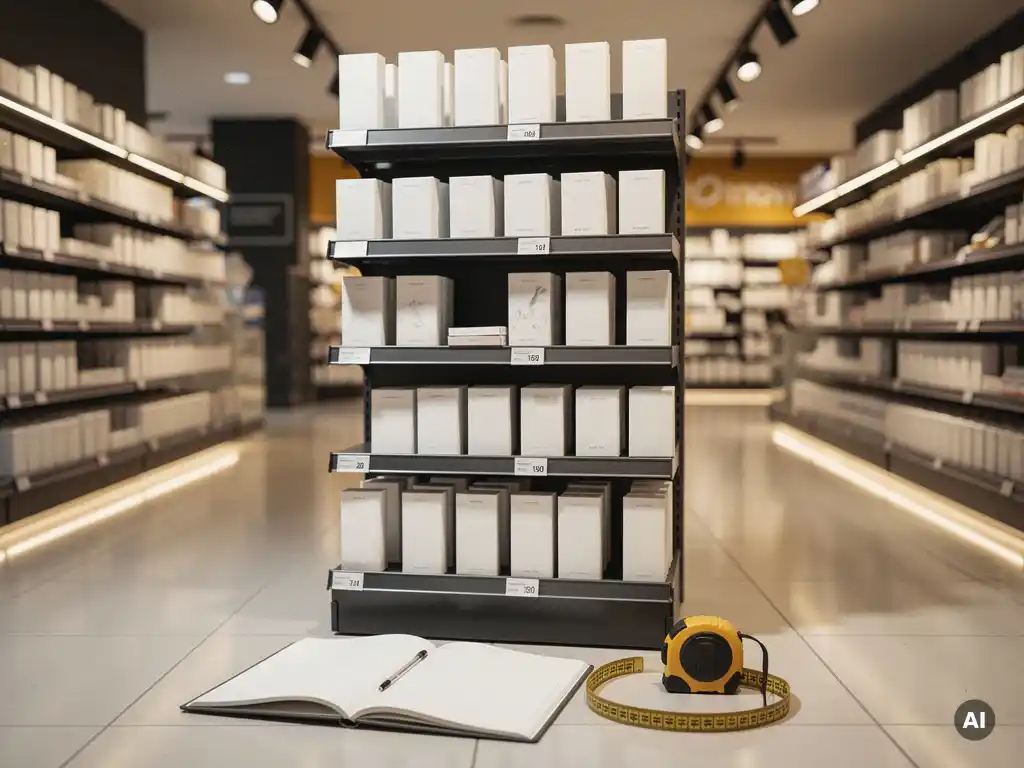
POS performance data informs future retail display decisions by revealing which formats, locations, and messages drive conversion and which do not. Brands that analyse sales uplift, compliance rates, and shopper behaviour alongside display rollouts gain a clear evidence base for refining fixture design, placement strategy, and creative execution. The sections below address the most important questions brands and retailers ask when putting that data to work.
The metrics that most accurately measure POS display performance are sales uplift at the display location, unit velocity compared to non-display SKUs, shopper dwell time, conversion rate at the fixture, and compliance rate across store locations. Together, these indicators distinguish displays that genuinely influence purchase decisions from those that occupy space without commercial return.
Sales uplift is the primary commercial signal. It compares sales of a product before, during, and after a display is live, isolating the display's contribution from wider promotional activity. Unit velocity measures how quickly stock moves from the fixture, which is particularly useful for temporary POS where the window of opportunity is short.
Dwell time and conversion rate require observational or digital measurement tools, such as heat mapping, footfall counters, or camera-based analytics. These reveal whether shoppers are stopping at the display and whether that attention translates into a product interaction or purchase. A high dwell time paired with a low conversion rate often signals a creative or structural issue with the fixture itself.
Compliance rate, which measures how many stores have the display installed correctly and on time, is frequently overlooked but has a direct impact on every other metric. A display that is absent, incorrectly positioned, or damaged cannot perform, making compliance data an essential baseline before any performance conclusions are drawn.
Sales data reveals which display formats drive conversion by enabling like-for-like comparison across fixture types, positions, and retail environments. When the same product is displayed using different formats across a store estate, sales variance between those formats points directly to which structural and creative choices are working hardest at the point of purchase.
For example, a freestanding display unit positioned at an aisle end may generate a measurably different sales rate than a shelf-edge unit or a countertop display carrying the same product. Isolating those variables across a controlled rollout gives brand owners reliable data to inform the next brief.
Category also matters. In pharmacy and health retail environments, displays that incorporate product information panels and clear dosage or benefit messaging tend to outperform purely visual fixtures, because the shopper's decision-making process is more considered. In impulse or gifting categories, visual impact and ease of product access are stronger conversion drivers. Sales data, segmented by format and category, surfaces these distinctions clearly.
Shopper behaviour data plays a central role in display redesign by identifying exactly where engagement breaks down. Metrics such as approach rate, interaction rate, and time-to-decision reveal whether a display is attracting attention, whether shoppers are engaging with the product, and whether the fixture's layout is supporting or obstructing the path to purchase.
When behaviour data shows that shoppers approach a display but do not interact with the product, the issue is typically structural. The product may be positioned too high or too low, access may be restricted, or the fixture's layout may not direct the eye effectively. Redesigning the physical architecture of the display, informed by this data, directly addresses the friction point.
When shoppers interact with the product but do not convert, the issue is more likely creative or informational. The messaging may not be communicating value clearly, or the pricing and promotional mechanics may not be visible at the point of decision. Behaviour data makes these distinctions possible, ensuring that redesign investment is directed at the right element of the display rather than applied uniformly.
Brands use compliance data to improve future rollouts by identifying which store locations, retail partners, or installation processes are consistently underperforming against the brief. When compliance is tracked systematically, patterns emerge that inform both the design of the display and the logistics of the installation programme.
Common compliance issues include incorrect placement, missing components, damaged graphics, and displays that have not been erected at all. Each failure type points to a different root cause. Placement errors may indicate that the display design does not account for the physical constraints of the store environment. Missing components suggest a packaging or fulfilment issue. Graphic damage points to a materials or transit problem.
Brands that review compliance data before briefing a new display programme can build solutions to known failure points directly into the design. Modular construction, clearer assembly instructions, more durable materials, and retailer-specific sizing are all design decisions that compliance history can justify and prioritise.
POS performance data should trigger a full display refresh when sales uplift has declined over consecutive measurement periods, when compliance rates have fallen below an acceptable threshold, or when shopper behaviour data shows a sustained drop in engagement that cannot be addressed through creative updates alone. A structural refresh is warranted when the fixture itself is limiting performance.
A useful distinction exists between creative fatigue and structural obsolescence. Creative fatigue occurs when shoppers have become accustomed to a display's visual language and it no longer commands attention. This is typically resolved through a graphic or messaging refresh without changing the underlying fixture. Structural obsolescence occurs when the display format no longer fits the retail environment, the product range it carries, or the expectations of the shopper. This requires a more fundamental redesign.
In practice, brands operating on annual or biannual review cycles should use performance data to assess whether a creative refresh is sufficient or whether the brief needs to go back to the design stage. Delaying a structural refresh when the data clearly indicates it is needed results in compounding losses across the store estate.
A design and manufacturing partner uses performance data in the briefing process by treating it as a design specification rather than a retrospective report. When a brand brings compliance rates, sales uplift figures, and shopper behaviour insights to the initial brief, the design team can make informed decisions about materials, dimensions, placement logic, and construction method from the outset rather than relying on assumptions.
This approach compresses the development cycle. Instead of building and testing multiple concepts without a performance baseline, the design team can focus creative effort on the variables that the data indicates are most likely to drive improvement. If previous compliance data shows that a particular fixture consistently fails in stores with limited floor space, the new design can prioritise a smaller footprint or wall-mounted alternative from the start.
Performance data also strengthens the relationship between brand and partner by creating a shared language of accountability. Both parties can agree on what success looks like before a display goes into production, and measure outcomes against those agreed benchmarks after rollout. This is the basis for a genuinely iterative retail display programme rather than a series of disconnected briefs.
Pivotal operates as a full-service retail design and manufacturing partner for brands that want their performance data to drive the next brief, not just evaluate the last one. The team brings together design, prototyping, manufacturing, and installation under one roof, which means insights gathered from a live rollout can be fed directly back into the development process without handover delays or communication gaps.
If your brand is ready to use retail display data to build a stronger next-generation POS programme, contact Pivotal to discuss how performance insight can be built into your next brief from day one.